PageSpeed Insights vs CrUX Vis: Why You Need Both to Judge Performance
Written by Avinash Chandran

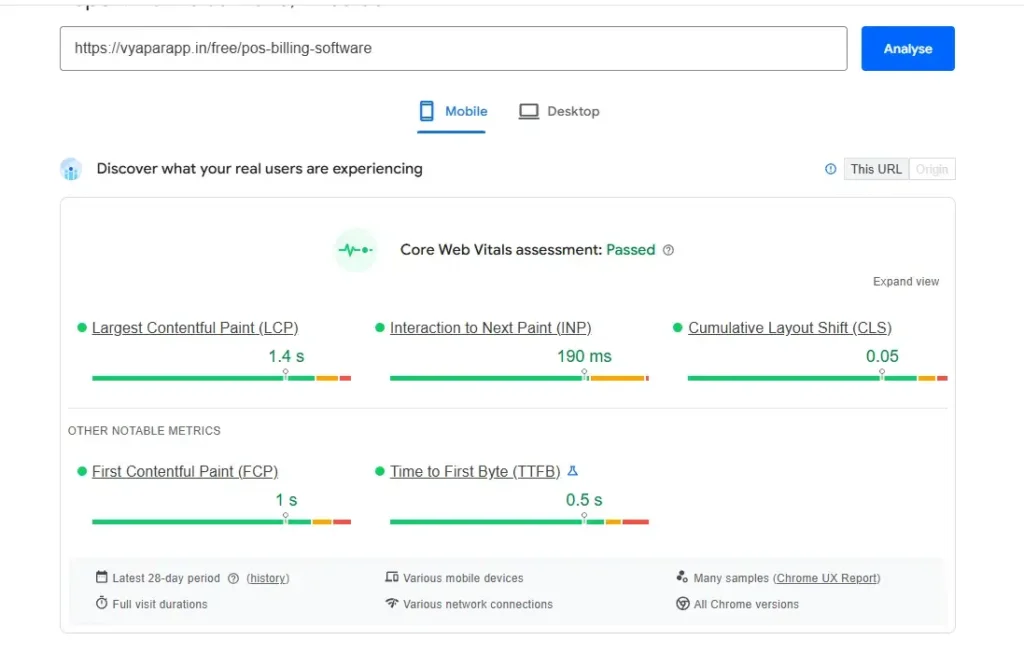
Last week I ran a quick performance check on one of Vyapar’s landing pages, /free/pos-billing-software. PageSpeed Insights handed me two numbers that completely disagreed with each other.
The field data said the page passed Core Web Vitals. LCP 1.4s, INP 190ms, CLS 0.05, all green.
Then I scrolled down to the lab data and saw a performance score of 64, with LCP sitting at a scary 7.1 seconds in red.
So which one is right? Both of them. And that contradiction is exactly why I never judge a page from a single PageSpeed run. I open CrUX Vis too. Here’s the difference between the two tools, and why you want both open.
PageSpeed Insights is a snapshot#
PageSpeed Insights is quietly stacking two very different things in one report.
The lab data comes from Lighthouse. It’s one synthetic test on a mid-range phone (a throttled Moto G Power on slow 4G, in this case). It’s a worst-case simulation. Useful for diagnostics, but it is not how your real users experience the page.
The field data comes from CrUX, the Chrome User Experience Report. That’s real Chrome users, over the last 28 days, measured at the 75th percentile. This is the number Google actually uses for page experience.
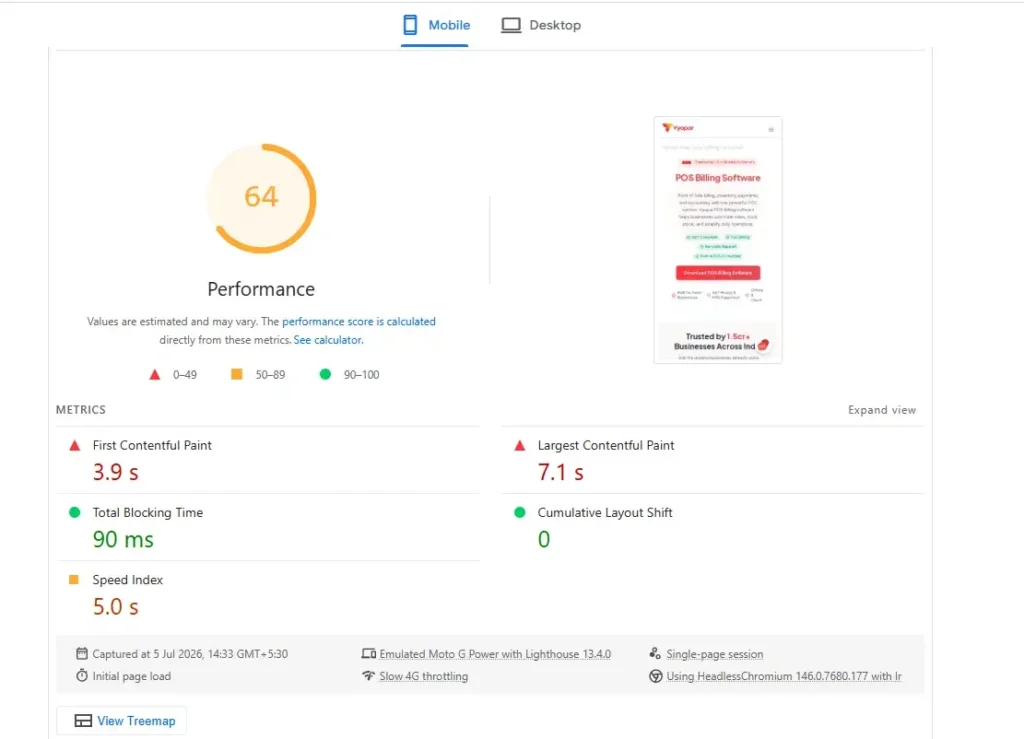
That gap explains everything. Lab says 7.1s because it’s hammering a slow device on a slow connection. Field says 1.4s because most real users are having a fast experience. Don’t panic at the lab score, and don’t ignore it either. It’s telling you there’s headroom.
But here’s the limit: PageSpeed Insights only ever shows you the latest 28 days. No history. No direction. You have no idea whether the page is getting faster or quietly falling apart. That’s the gap CrUX Vis fills.
CrUX Vis is the whole movie#
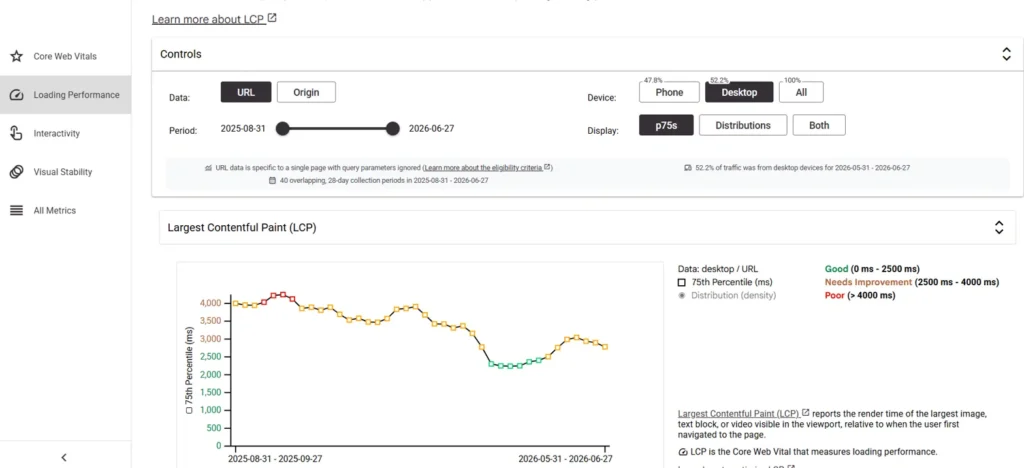
CrUX Vis pulls from the exact same real-user CrUX data PageSpeed uses, but it plots it over the last 40 weeks instead of a single window.
Look at the LCP graph for this same page. On desktop it started up in the red around 4,000ms, slowly worked its way down, dipped into green near 2,300ms, and now sits around 2,800ms. That’s a whole story, and you would never see it from one PageSpeed check.
The Core Web Vitals summary is the part I open first. It doesn’t just show values, it tells you the direction each metric is moving. On this page: loading performance needs improvement but is improving. Interactivity is good but regressing. Visual stability needs improvement and is regressing.
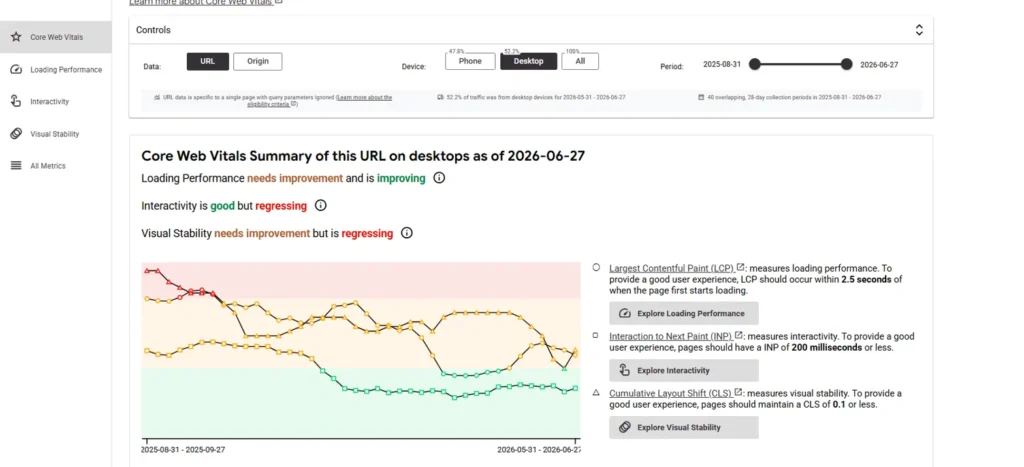
That word “regressing” is the whole point. A page can pass today and still be sliding toward a fail, and CrUX Vis flags it weeks before Search Console ever emails you about it.
Why this actually matters for SEO#
Core Web Vitals feed into page experience, and Google looks at the real-user field p75, not your lab score. So the number that matters for rankings is the real-user trend, and CrUX Vis is where you watch it move.
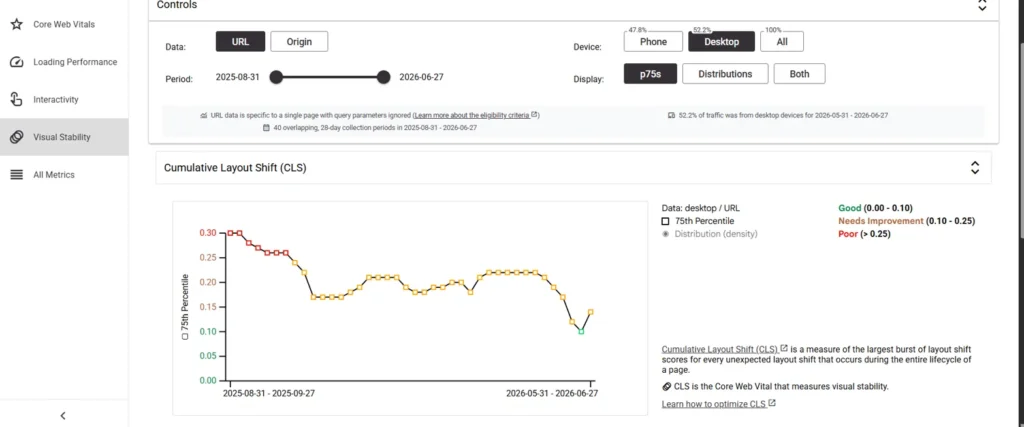
Take the CLS graph on this page. It’s been bouncing between 0.17 and 0.22 for months, well inside “needs improvement,” with a recent wobble back up. A single PageSpeed run might catch it on a good day and tell you everything is fine. The trend tells you the truth.
A few more things CrUX Vis gives you that PageSpeed won’t: you can toggle URL versus origin, split mobile versus desktop, and break LCP down into its parts (TTFB and FCP) to find what’s actually slow. It works on any site with enough traffic, so it’s brilliant for auditing competitors too.
How I use both together#
Simple workflow:
- PageSpeed Insights first for the quick check and the lab diagnostics: the render-blocking scripts, the oversized images, the stuff I can go fix today.
- CrUX Vis second to answer the real question. Is the real-user trend going the right way? Is any metric regressing? Did my last fix actually move the p75, or did it just look good in the lab?
One is your diagnosis. The other is your vitals monitor. PageSpeed tells you where the page is right now. CrUX Vis tells you where it’s heading.
And that second question is the one that keeps you from optimizing for a Lighthouse score while your real users quietly have a worse and worse time.